
python – 等值线(contour)数值添加白色背景边框
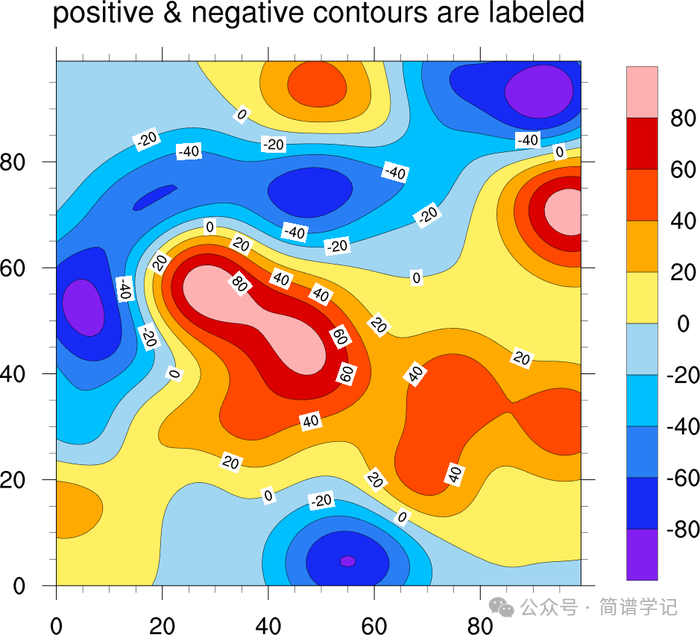
如下图所示,这是NCL官网示例的等值线绘图。可以看到,图中的每条等值线都有一个白色的矩形边框,使其在黑色等值线中更为清晰明了,提高了可读性。
-
然而,我目前主要使用 python,希望能在python中实现同样的效果。如果无法实现,我将考虑学习NCL进行绘图。

以下是实现的ncl脚本代码:
;----------------------------------------------------------------------
; conLab_8.ncl
;
; Concepts illustrated:
;   - Formatting contour line labels to force the number of digits
;   - Generating dummy data using "generate_2d_array"
;   - Making the labelbar be vertical
;   - Formatting labelbar labels using "sprintf"
;----------------------------------------------------------------------
; See tickmark example tm_8.ncl for more xxxFormat examples:
;
; http://www.ncl.ucar.edu/Applications/Images/tm_8_lg.png
;----------------------------------------------------------------------
;
; These files are loaded by default in NCL V6.2.0 and newer
; load "$NCARG_ROOT/lib/ncarg/nclscripts/csm/gsn_code.ncl"
; load "$NCARG_ROOT/lib/ncarg/nclscripts/csm/gsn_csm.ncl"

begin
;---Generate some dummy data.
  data = generate_2d_array(15, 15, -100., 100., 0, (/100,100/))

;---Contour levels to use.
  data_levels = ispan(-85,85,5) + 5.587

;---Open a png file to draw graphics to.
  wks = gsn_open_wks("png","conLab")

;---Set up resources.
  res                       = True

  res@gsnMaximize           = True

  res@cnFillOn              = True        ; Turn on contour fill
  res@cnLineLabelsOn        = True        ; Turn on contour line labels

  res@cnLevelSelectionMode = "ExplicitLevels"
  res@cnLevels             = data_levels

  res@lbOrientation        = "Vertical"

  res@tiMainString         = "Default line labels and labelbar labels"
  plot = gsn_csm_contour(wks,data,res)  ; Create filled contour plot


  res@cnLineLabelFormat    = "0@;*.3f"                      ; Only one value after decimal point
  res@lbLabelStrings       = sprintf("%5.1f",data_levels)   ; Format the labelbar labels
  res@tiMainString         = "Formatted line labels and labelbar labels"

  plot = gsn_csm_contour(wks,data,res)  ; Create filled contour plot


end
python绘制等值线
首先,在python中绘制等值线,用到的函数为plt.contour(X, Y, Z, colors='black', levels=contour.levels),为其添加等值线数值的函数为,这里需要将plt.contour(X, Y, Z, colors=’black’, levels=contour.levels)赋值为一个变量clabels:
plt.clabel(clabels, inline=True, fontsize=8,
           fmt=fmt,
           colors='black',
           use_clabeltext=True,
           manual=False)
目前,虽然我们查找了plt.clabel函数,但未找到可以直接改变等值线数值背景颜色的相关参数。因此,我们只能从其他角度寻找解决方案。
-
首先,等值线的数值实际上是一些 text文本。我们通常使用matplotlib.pyplot.text(x, y, s, fontdict=None, **kwargs)来添加图上的文本信息,而text本身具有添加背景色的功能。 -
因此,我们只需遍历每一个等值线上的数值文本,然后设置文本参数即可。
虽然这个描述可能有点复杂,但在代码中很容易理解:
首先,我们生成一个等值线图像,如下所示:
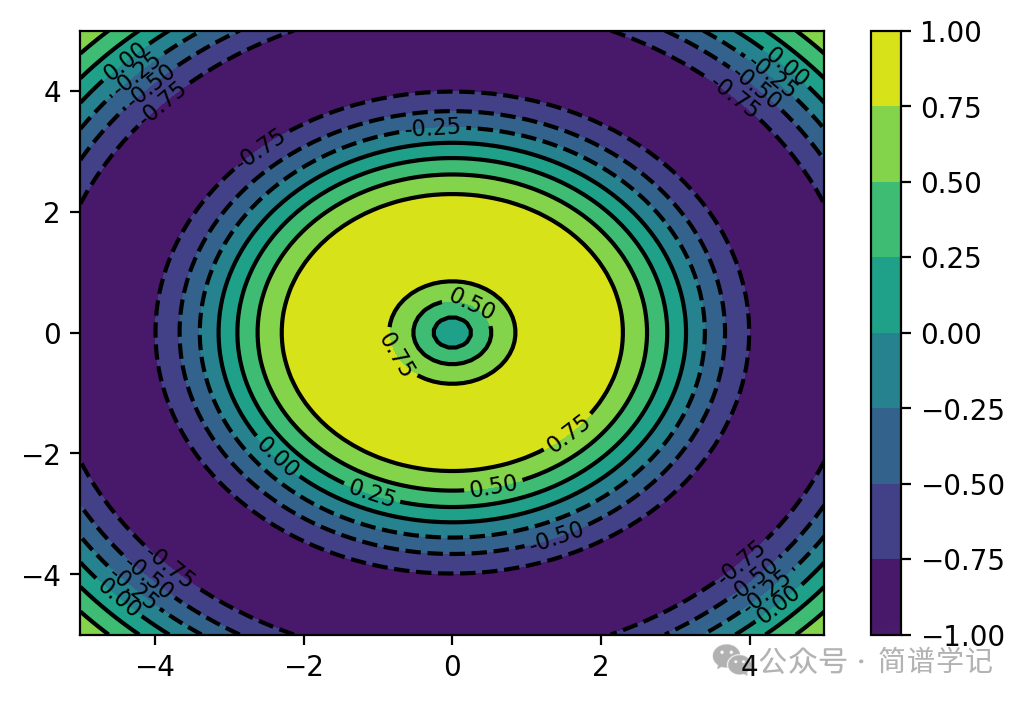
代码如下:
import numpy as np
import matplotlib.pyplot as plt

# 生成一些示例数据
x = np.linspace(-5, 5, 100)
y = np.linspace(-5, 5, 100)
X, Y = np.meshgrid(x, y)
Z = np.sin(np.sqrt(X**2 + Y**2))

# 创建一个带有白色背景的等值线图
fig, ax = plt.subplots(dpi=200)

contour = ax.contourf(X, Y, Z, cmap='viridis')

cbar = plt.colorbar(contour)

fmt = '%.2f'
clabels = plt.contour(X, Y, Z, colors='black', levels=contour.levels)
plt.clabel(clabels, inline=True, fontsize=8,
           fmt=fmt,
           colors='black',
           use_clabeltext=True,
           manual=False)
添加边框
设置等值线文本信息,实际上就是for 循环加if 判断。这里加上if判断是为了只显示想要的数值对应的背景色
[txt.set_bbox({'boxstyle': 'round',
            'facecolor': 'w',
            'edgecolor': 'black',
            'pad': 0.04}) if txt.get_text() in ('0.5','0.25', '-0.5','-0.25') else txt.set_visible(False) for txt in  clabels.labelTexts]
其中,boxstyle设置文本box的风格,矩形还是圆形等;facecolor和edgecolor不说了,pad可以理解为设置矩形框的宽窄程度,可以自己调整数值测试一下效果。
最终得到的结果如下:
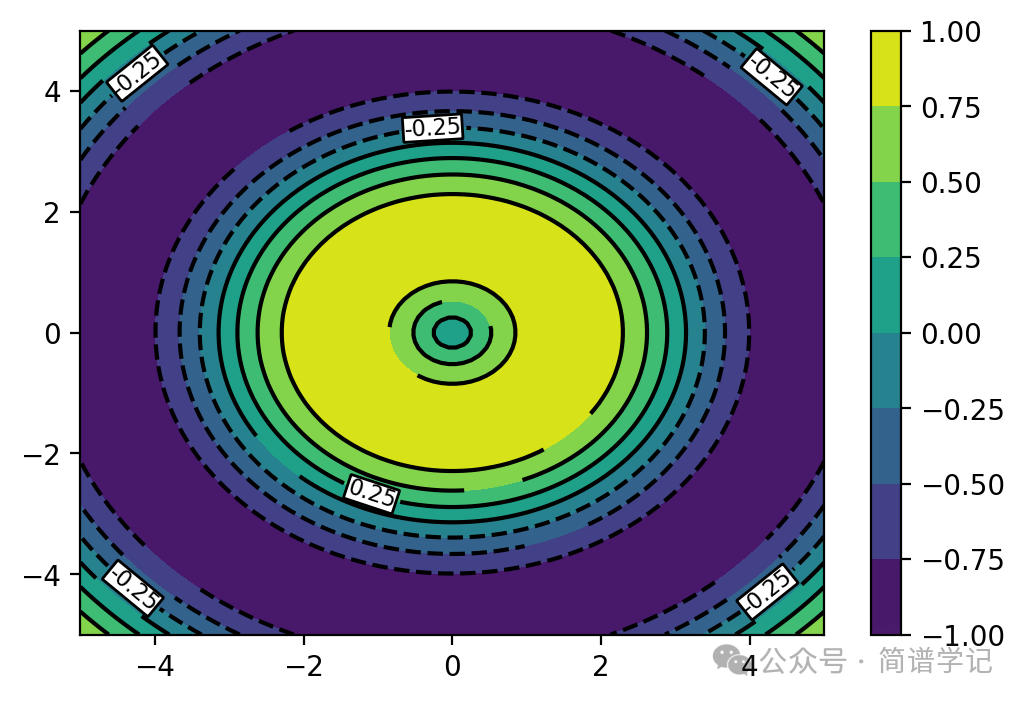
基本上是实现想要的目的,以下是全部代码:
"""

@author: jianpu

@email:  Blissful.Jasper@outlook.com

introduction : keep learning althongh walk slowly
"""

import numpy as np
import matplotlib.pyplot as plt

# 生成一些示例数据
x = np.linspace(-5, 5, 100)
y = np.linspace(-5, 5, 100)
X, Y = np.meshgrid(x, y)
Z = np.sin(np.sqrt(X**2 + Y**2))

# 创建一个带有白色背景的等值线图
fig, ax = plt.subplots(dpi=200)

contour = ax.contourf(X, Y, Z, cmap='viridis')

cbar = plt.colorbar(contour)

fmt = '%.2f'
clabels = plt.contour(X, Y, Z, colors='black', levels=contour.levels)
plt.clabel(clabels, inline=True, fontsize=8,
           fmt=fmt,
           colors='black',
           use_clabeltext=True,
           manual=False)

[txt.set_bbox({'boxstyle': 'round',
            'facecolor': 'w',
            'edgecolor': 'black',
            'pad': 0.04}) if txt.get_text() in ('0.5','0.25', '-0.5','-0.25') else txt.set_visible(False) for txt in  clabels.labelTexts]


plt.show()
原创文章,作者:guozi,如若转载,请注明出处:https://www.sudun.com/ask/78944.html